5 minute read
PROJECT HIGHLIGHTS
THE TEAM
TOOLS USED
TIMELINE

Hey there, you busy recruiters and managers 👋
If you're short on time, here's a quick rundown to get you up to speed. (Readers interested in more detail might prefer to skip this summary and start with the next section.)
DataGuardian (customer name anonymized for privacy) specializes in storing Salesforce data that powers crucial business interactions worldwide. Their latest mission? To transform their vault of data backups into pure gold with Machine Learning, powered by a bit of magic 🪄 from the folks at TensorIoT.
As the sole designer on the project team, I kicked things off by conjuring up a dashboard that's far from your average data display, in an action-packed two week sprint. Leveraging insights from stakeholder interviews and informal user research, I rapidly crafted a dashboard that turned everyday business data into a compelling narrative.
This initiative will arm the sales teams of DataGuardian's clientele with razor-sharp new insights on their existing data. They'll be able to easily spot their most promising sales opportunities, ensuring their actions hit their targets with unmatched accuracy and impact.

Meet our customer DataGuardian, anonymized here to honor confidentiality agreements. Today, DataGuardian offers a solution to securely store what's essentially the diary of the business world—Salesforce CRM data, where companies jot down every customer interaction, from the smallest nod to the firmest handshake. Yet, the real magic DataGuardian plans to unleash is still on the horizon. Their next move? Transforming customers' data into sharp insights, set to empower businesses to make bold, informed decisions.
To start, DataGuardian concentrated on their clients' sales data within Salesforce — just the first area among many, like marketing and operations, ripe for exploration. Their goal was to pinpoint the best opportunities for their clients' sales team to pursue, turning mere data storage into a rich source of actionable insights.
Enter the TensorIoT team. My role as the sole designer on this project was to distill the complexities of the available data and machine learning predictions into designs for a clear, engaging dashboard. This wasn't just about making data look pretty; it was about crafting a tool that would become indispensable to DataGuardian's clients, enabling their sales teams to zero in on opportunities with the biggest yields.

In our initial discovery and design sprint, my knack for asking incisive questions and bringing customer ideas to life steered the project, ensuring smooth and successful progress. Here are some highlights:
To start, I tapped into our sales team's knowledge about DataGuardian's goals and challenges to shape some initial design sketches.
In preparation for our initial discovery sessions, I crafted rough sketches reflecting our sales team's insights and the customer-defined use case as outlined in our contract:
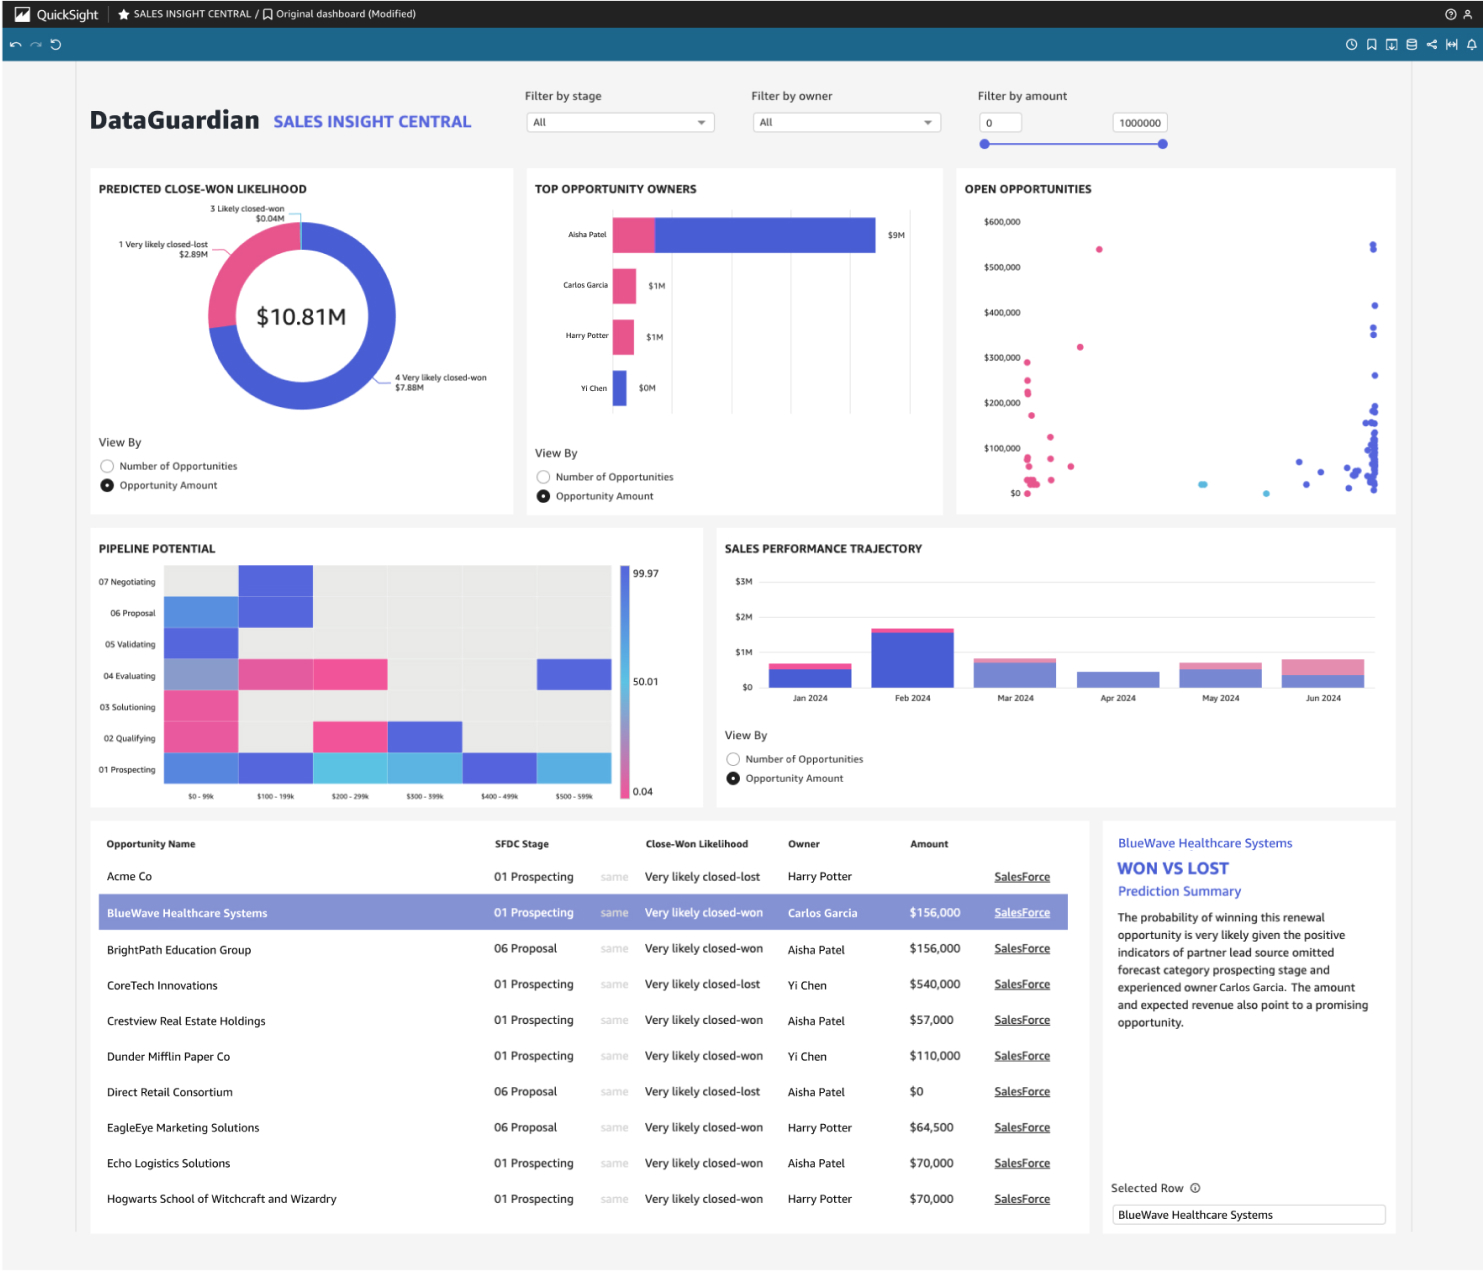
Ability to visualize inference results via a QuickSight dashboard:
This sketch would help ground our conversations, allowing the stakeholders to point to parts of the design while they described what they’re looking for.
Next up - my first meeting with the DataGuardian stakeholders, where I learned more about their business requirements and users. Some of my key takeaways from this session included:
During our initial discovery call, I realized my sketches weren't compelling or "cool" enough for DataGuardian’s needs. So, I revisited the designs, drawing inspiration from QuickSight's DemoCentral and discussing available data with our developers to brainstorm new graph concepts.
Despite typical project constraints like limited time and resources for user research, I identified a chance for valuable user insight right within our team. Given our own sales team perfectly matched the target user profile, I initiated some quick, direct user research.
I met with our project's sales rep and the sales team manager to understand their methods for prioritizing and evaluating sales opportunities. Their insights were crucial; we discussed not just how they identify promising opportunities, but also how the manager assesses training needs or recognizes top performers, and evaluates the effectiveness of our sales strategy.
Through several more cycles of discovery, sketch iterations, and review with both the customer and developers, I honed in on graph choices that narrated a well-rounded and compelling story, enriched by insights from my user research.
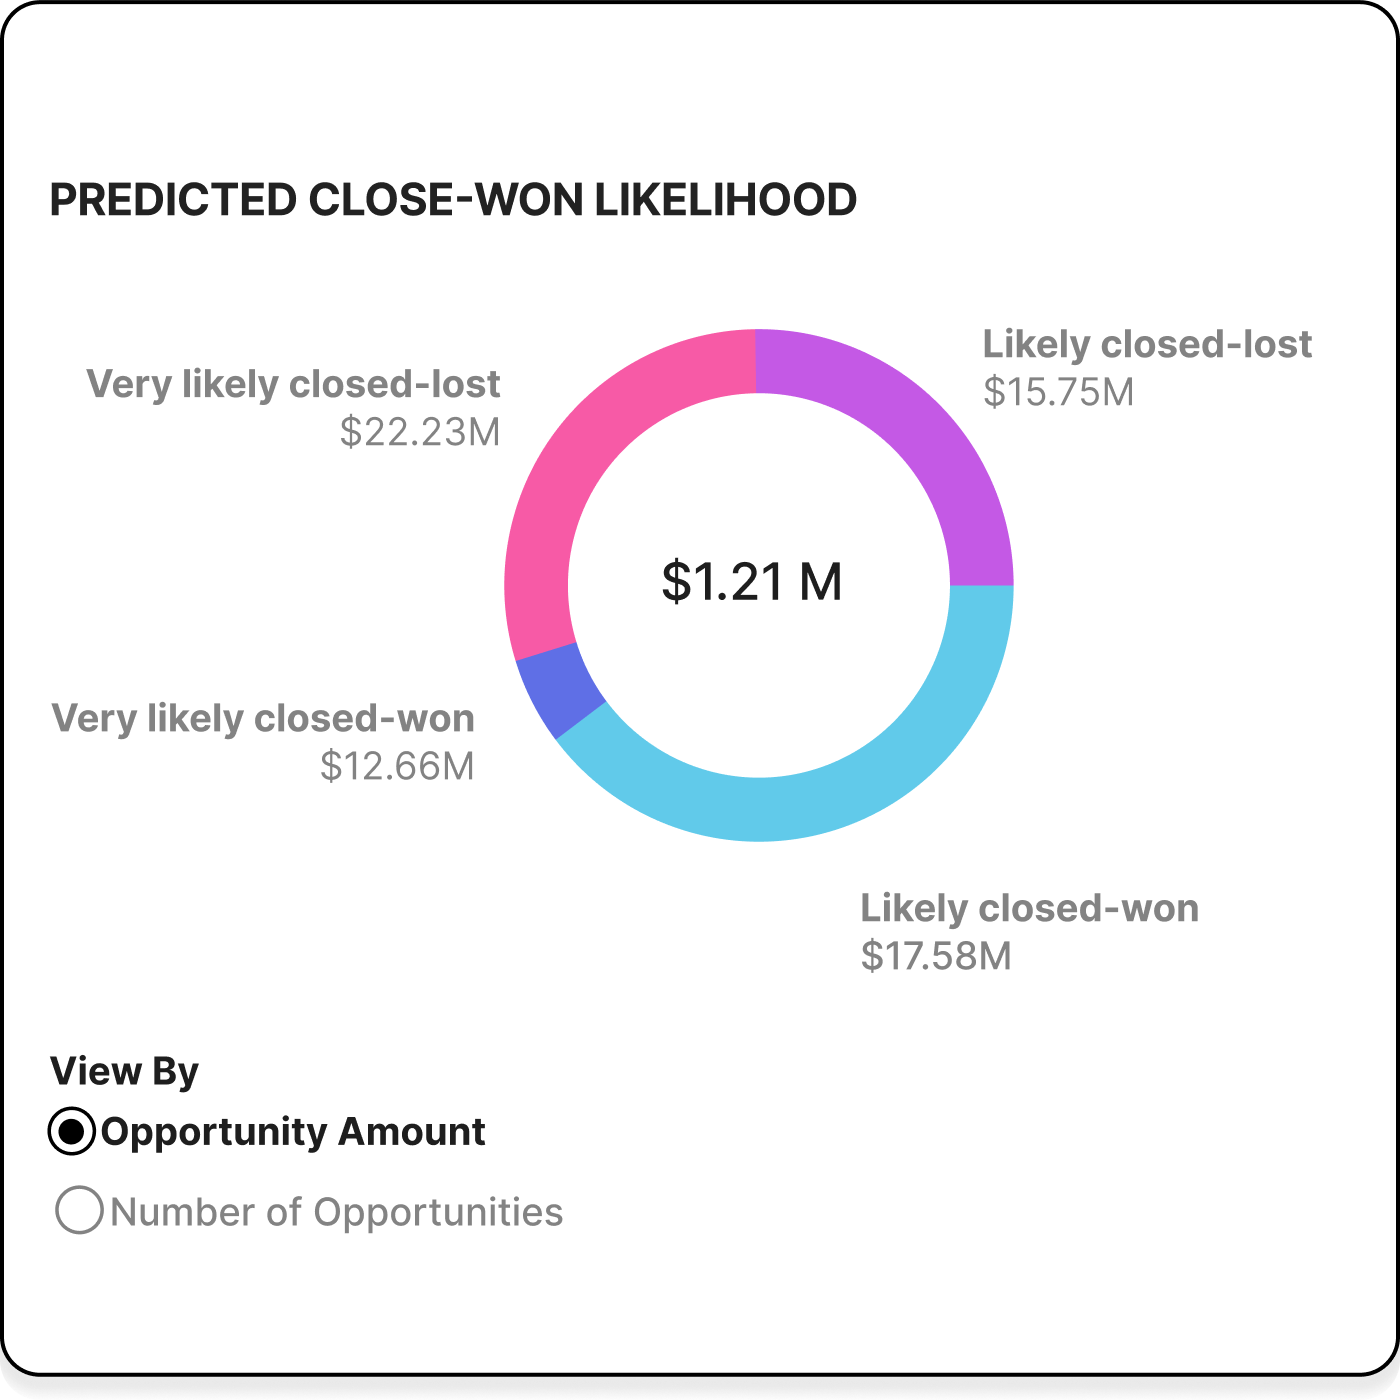
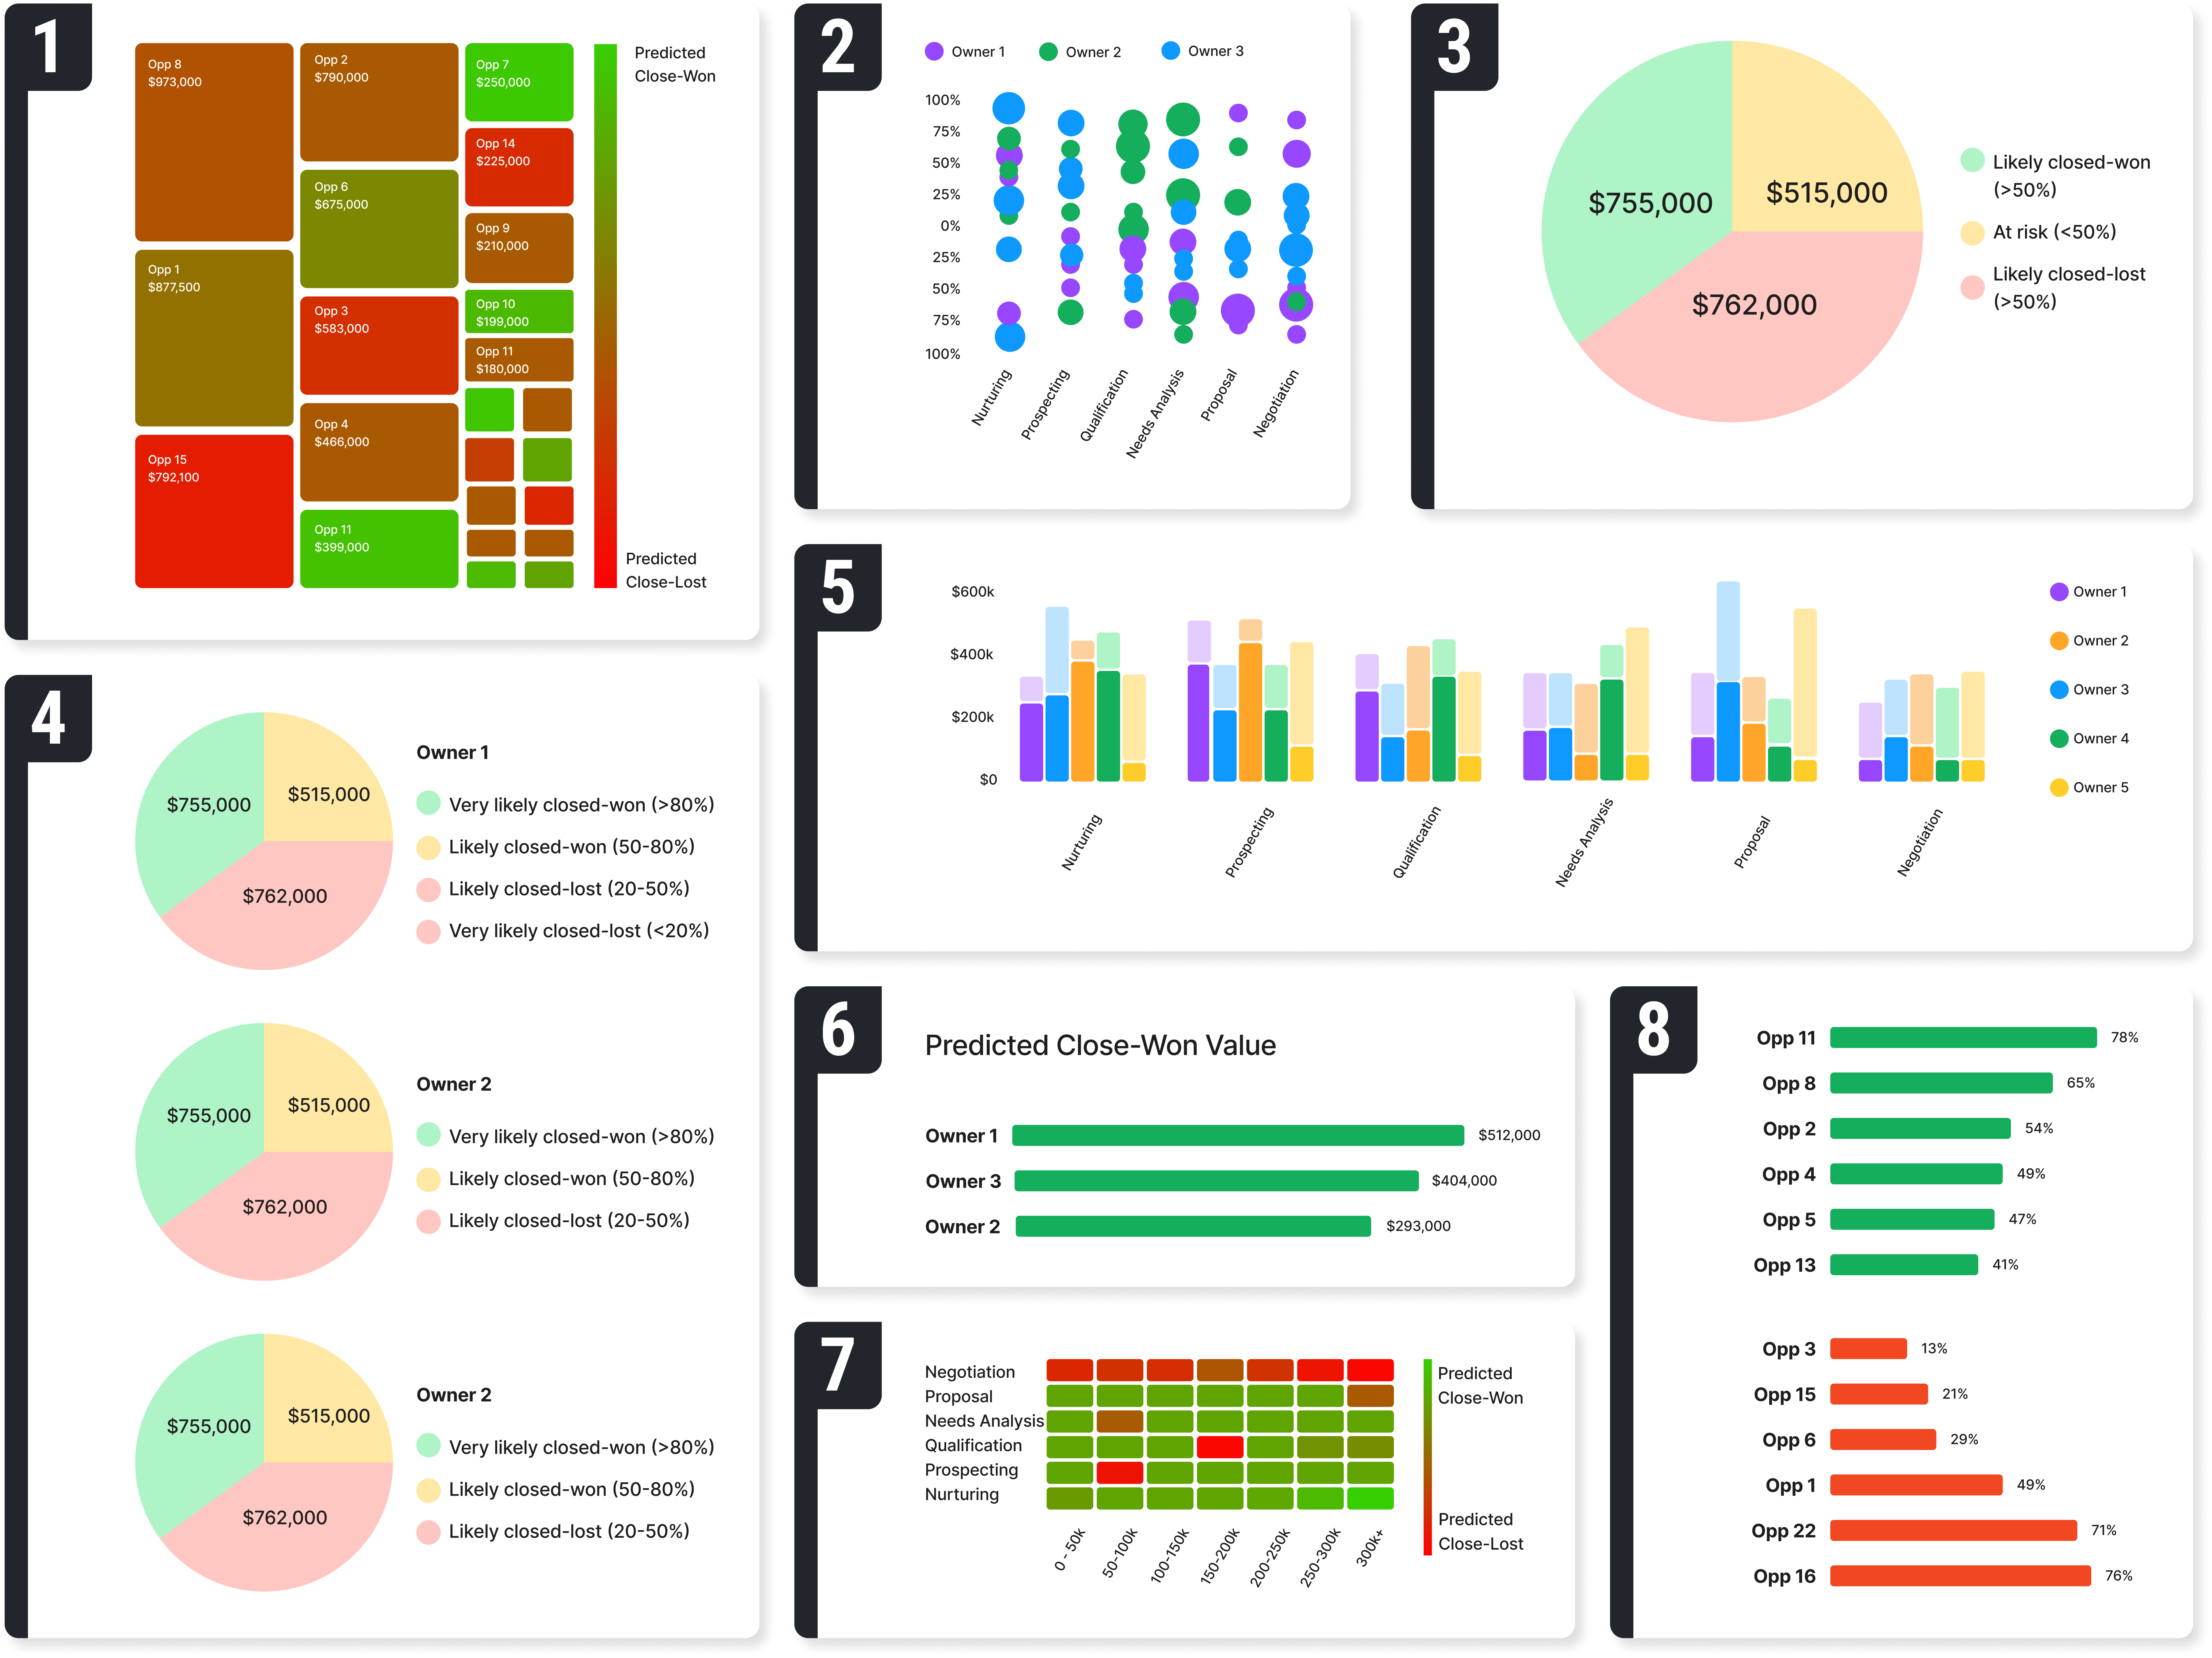
Simplicity Wins: Individual sellers, pressed for time, prefer straightforward visuals. Complex graphs like heat maps lose them, while simpler ones like pie charts hit the mark.
This pie chart provides clear, quick insights, allowing sales reps to see their win and loss potential at a glance. By showing the likely revenue from potential deals, it helps sellers prioritize their efforts and focus on strategies that maximize earnings and meet sales targets efficiently.
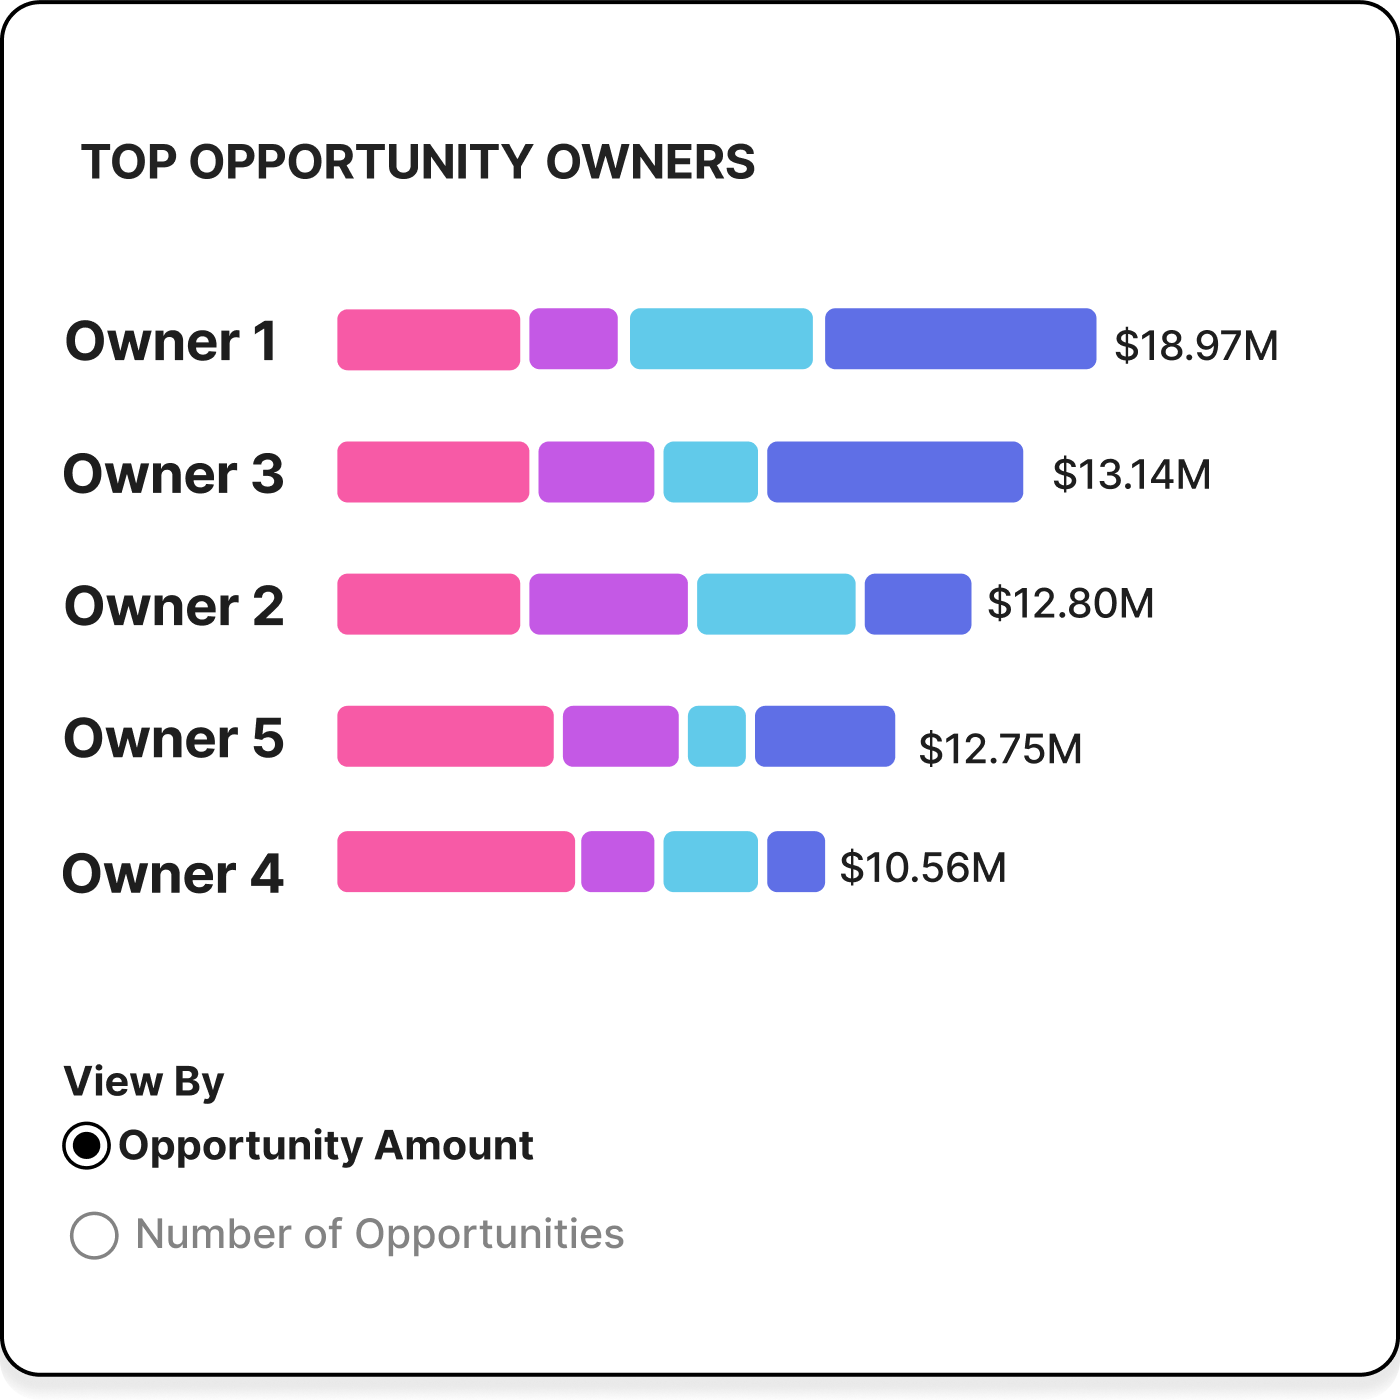
Competitive Spirit: Showing where they stand compared to others fuels individual sellers' drive, with visualizations of rankings pushing them to excel.
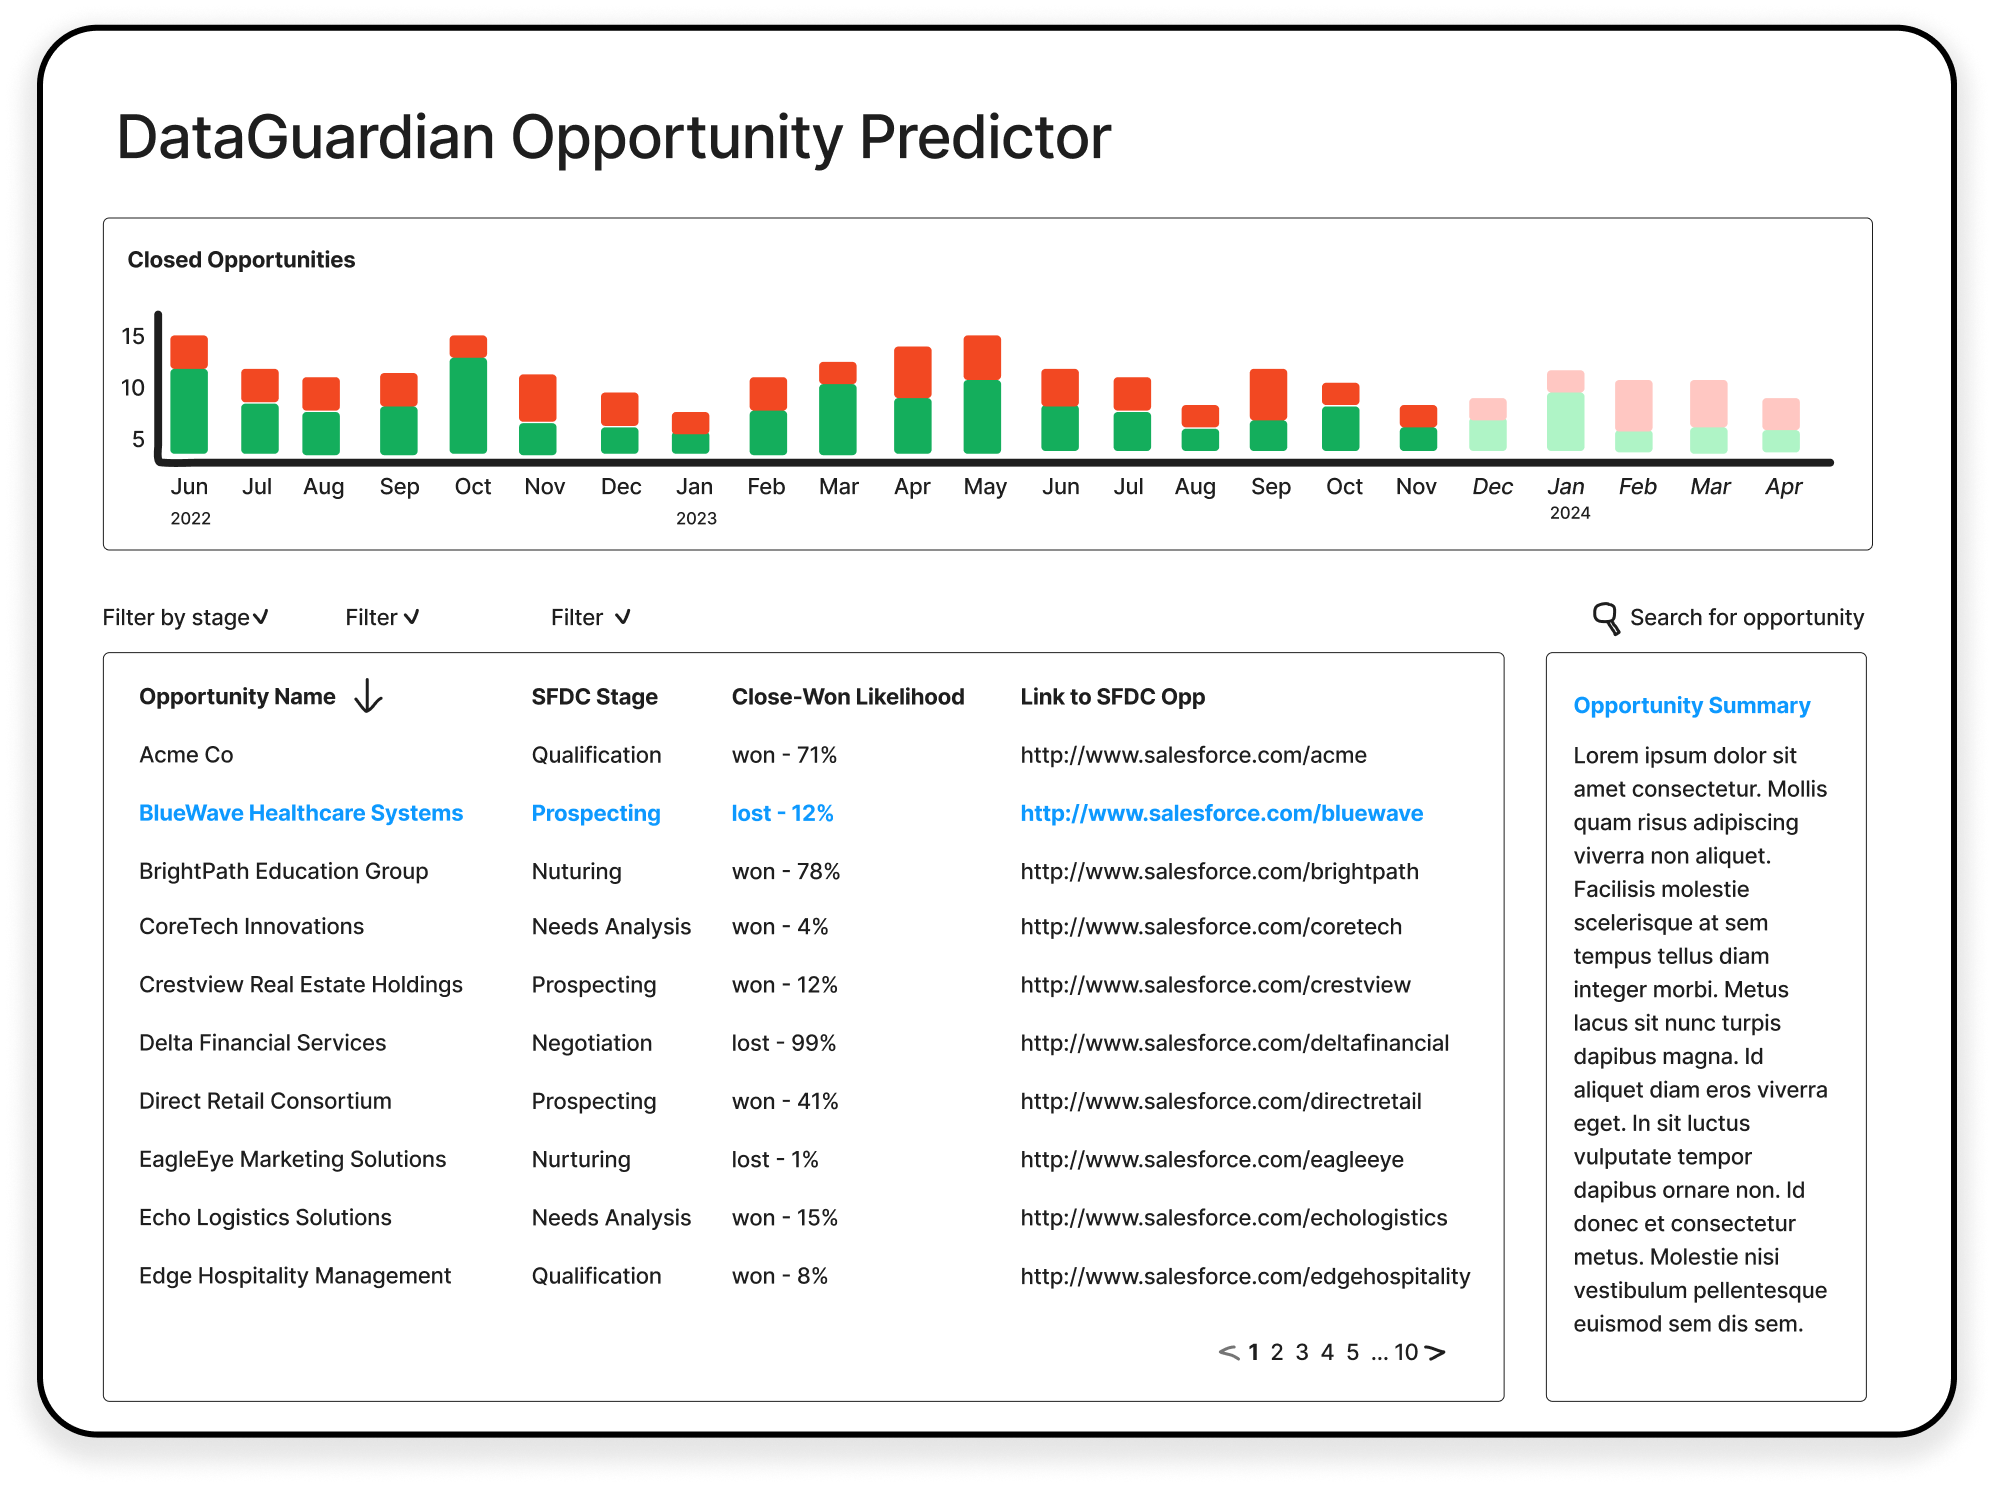
This leaderboard illuminates each seller's standing with color-coded predictions of close-won likelihood, sparking a drive to not just climb the ranks but also focus efforts on the most winnable deals to improve their standing and the company's bottom line.
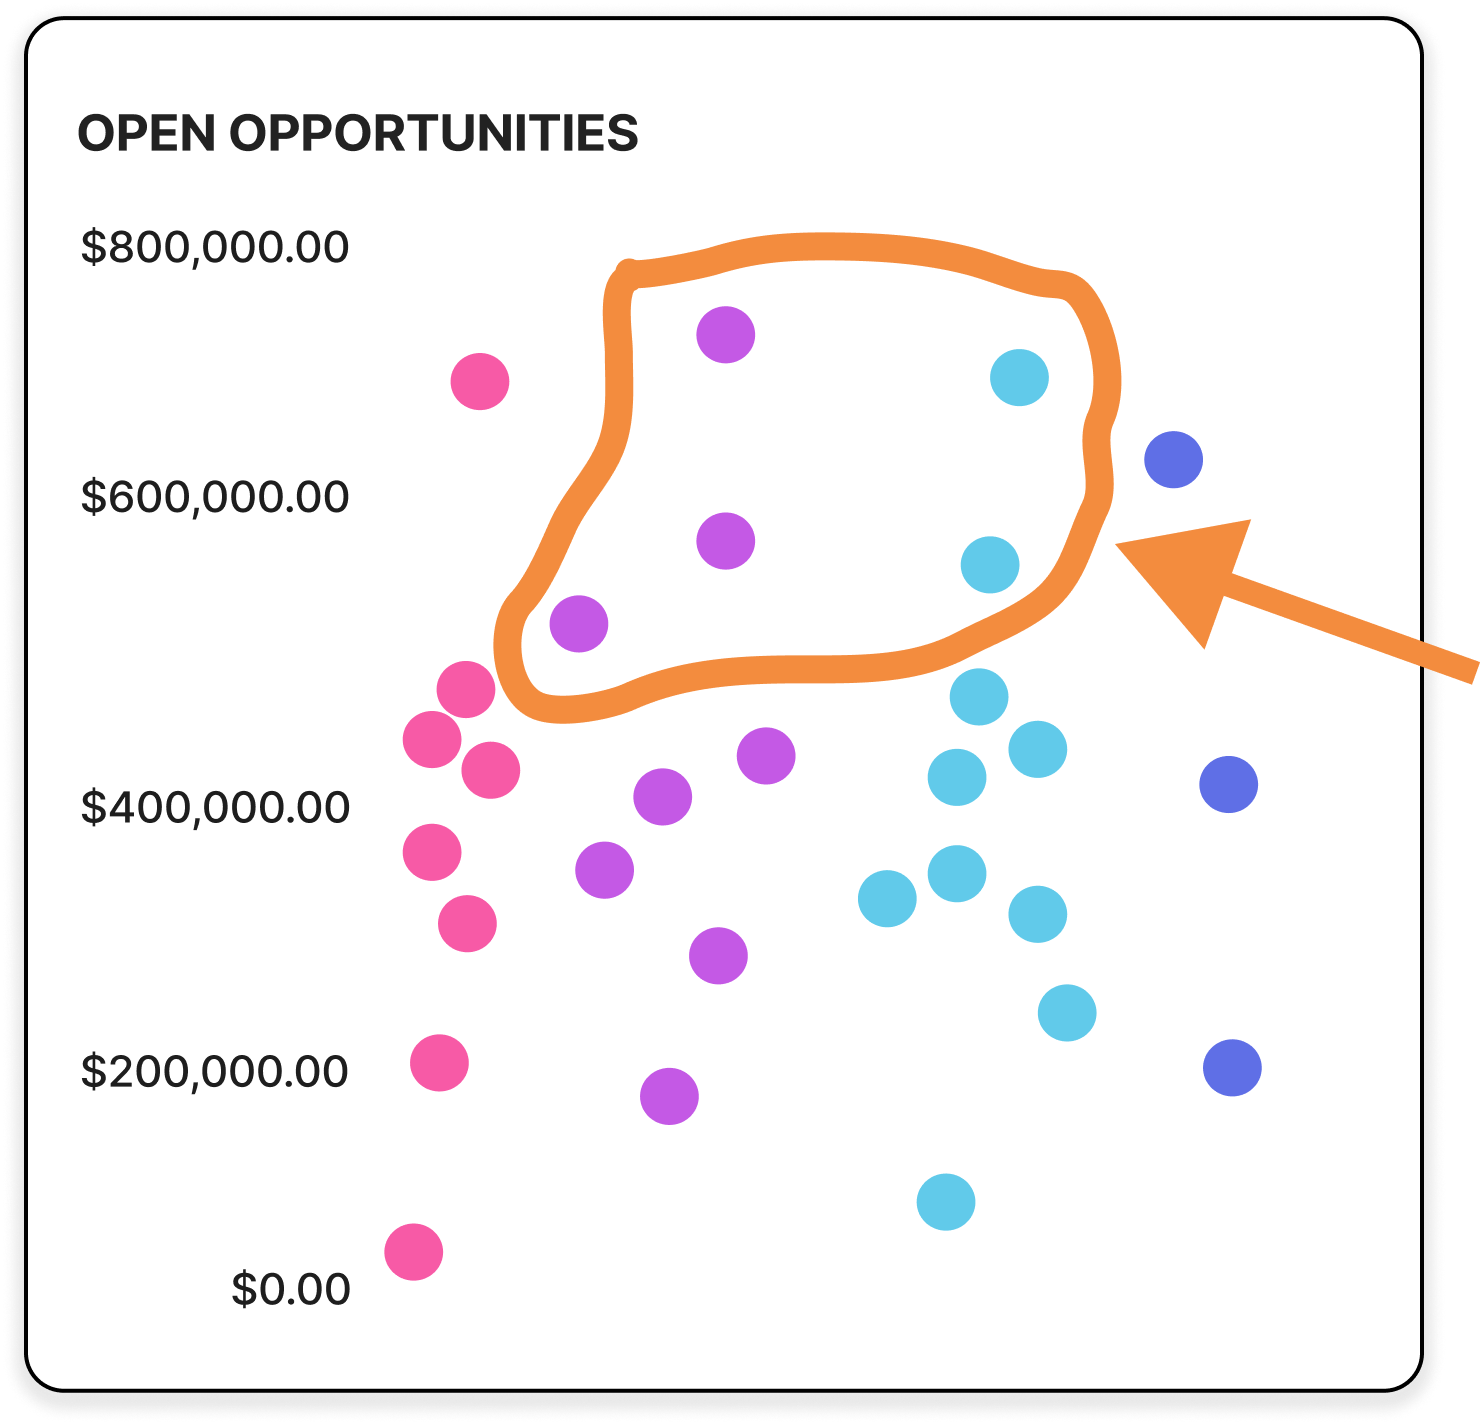
Effort vs. Reward: Sellers aim to maximize returns with minimal effort, seeking insights into which opportunities could yield the biggest rewards with the least effort, enabling them to pursue even more deals.
The scatter plot points sellers to high-value, undecided deals at the top-middle — the sweet spot for effort to yield big wins. Deals towards the bottom promise less reward, while those on the far left and right are unlikely to change, even with more effort, marking the center as the strategic focal point for sellers.
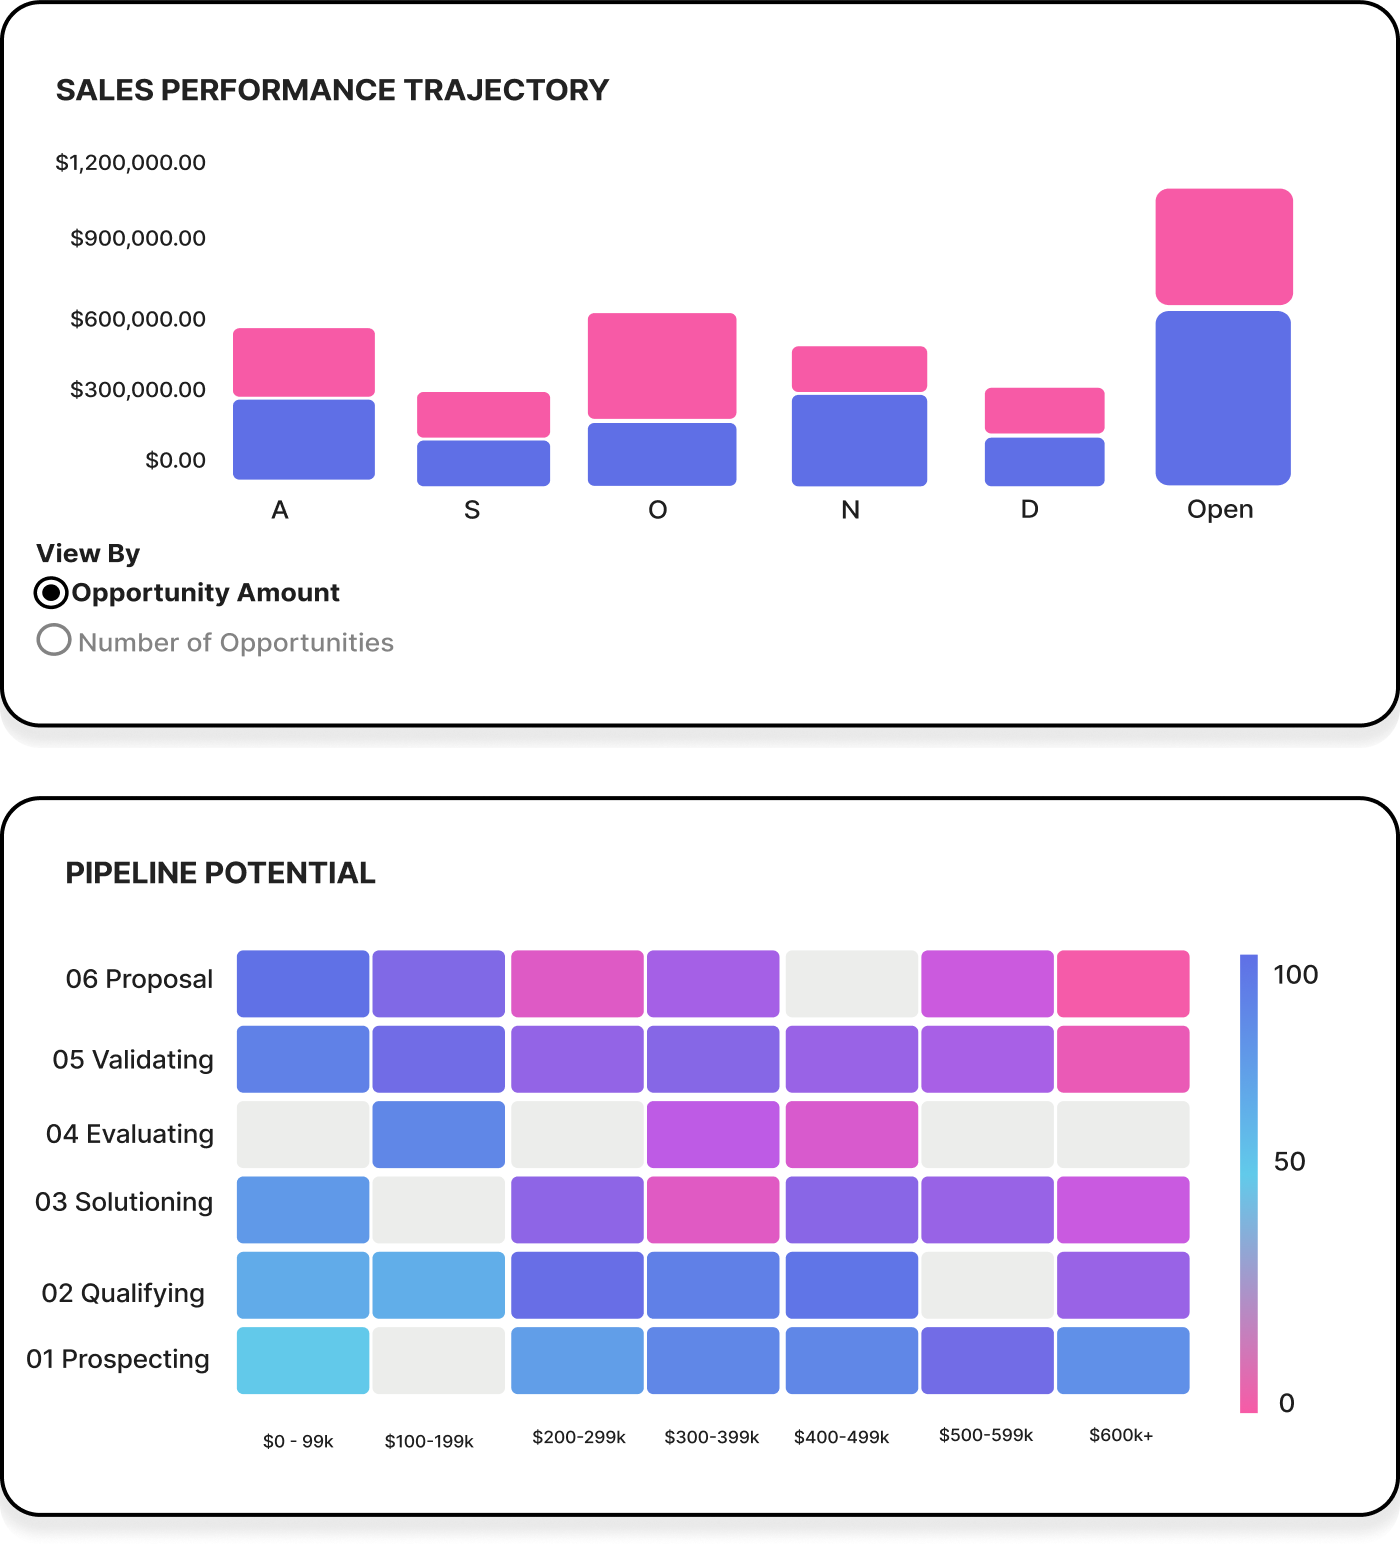
Big-Picture Concerns: Sales managers focus on the broader health of the team, from the adequacy of support and recognition to training needs and overall performance forecasts.
The 'Sales Performance Trajectory' graph shows a monthly view of wins and losses, helping managers forecast and evaluate the sales pipeline's health.
'Pipeline Potential' uses a heatmap to display open opportunities by likelihood of closing, value, and stage, empowering managers to adjust tactics and training whenever deals deviate from expected success rates.
Aesthetically, we transitioned from grey-scale sketches to a basic red-yellow-green palette for simplicity, and finally to the company's branding colors for a sophisticated yet clear performance categorization.
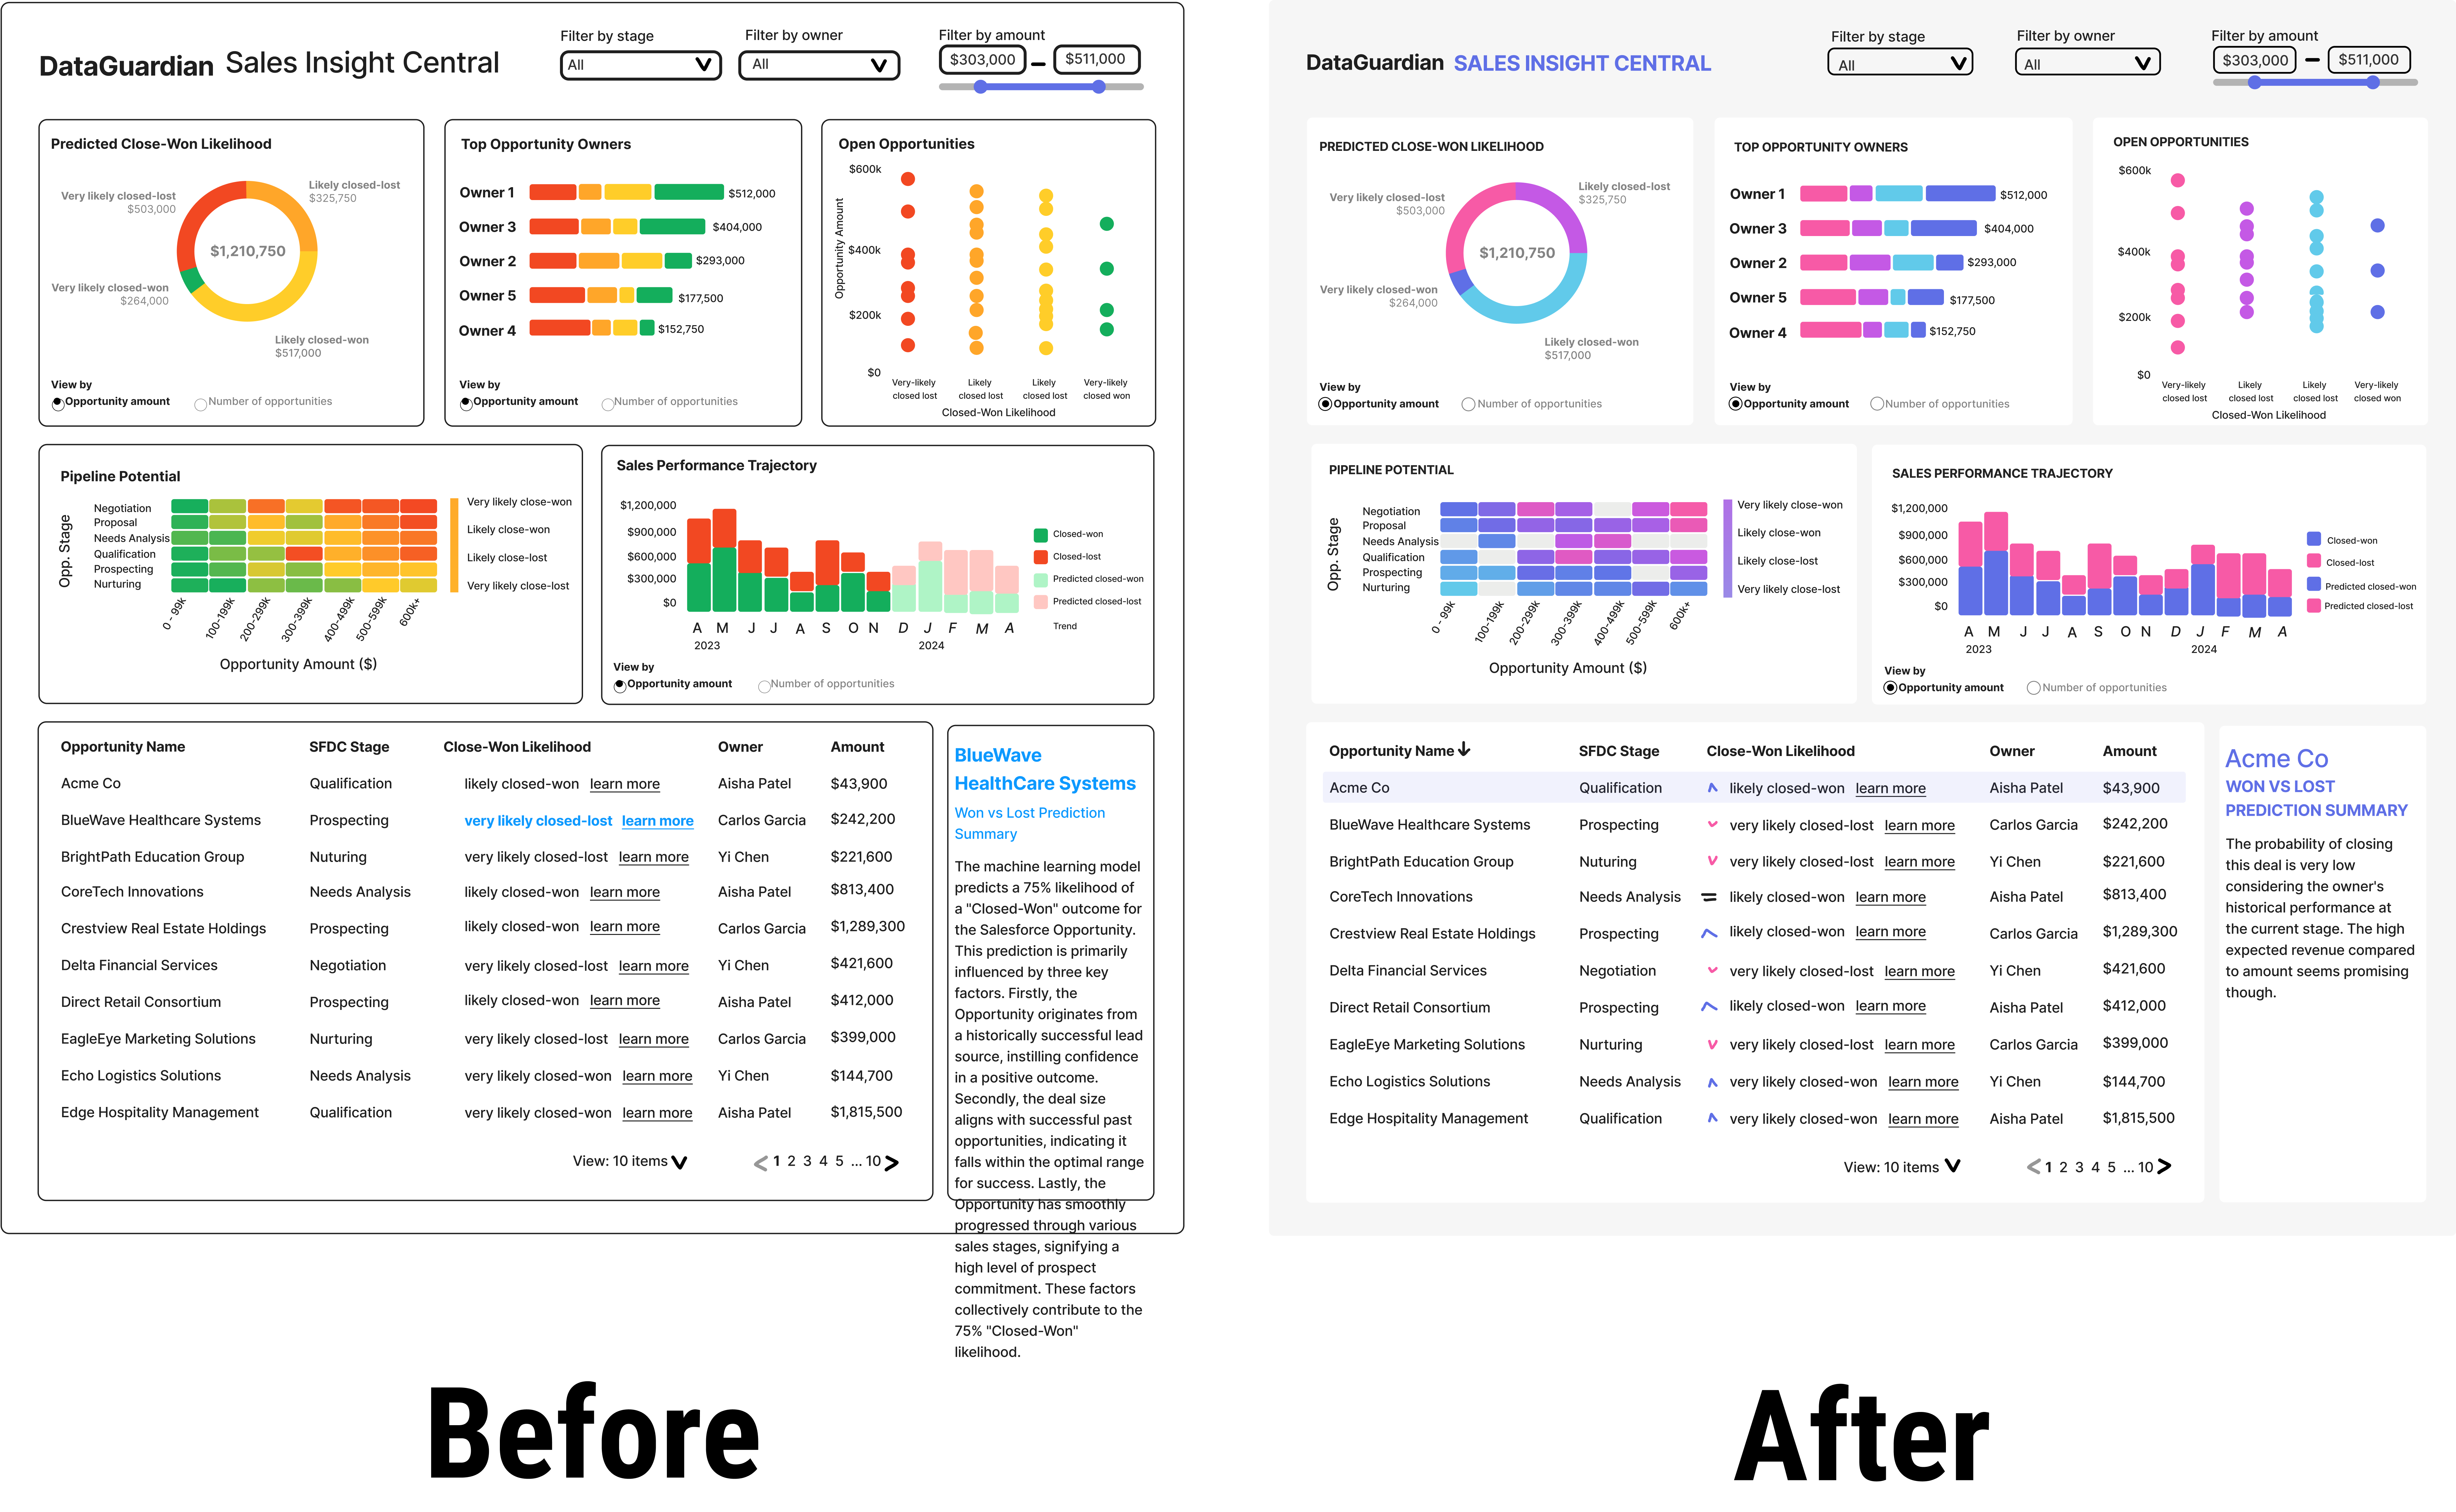
DataGuardian said that it was critical that the dashboard looked “cool”, so that their potential customers would be excited to buy it.
While the red-yellow-green color pallet I chose initially made it super easy for users to read the dashboard, it looked unpolished and basic.
I experimented with applying their branding colors, and the final result not only looked a lot more elegant, but also looked like it belonged in DataGaurdian’s application ecosphere.
By the end of the two-week sprint, I secured design sign-off, confirming that the designs perfectly aligned with DataGuardian’s vision in content, flow, and structure. This milestone also meant that developers could move forward full-speed-ahead, building out the dashboard with certainty and little to no anticipated changes.
As we moved from design to development, our goal was to make sure the dashboard matched our vision, tackling technical challenges with creativity. I led the effort to keep design and development in sync, frequently reviewing the UI against my designs and discussing discrepancies with developers.
Challenges arose when developers indicated certain parts of my designs weren’t feasible within QuickSight. In those moments, I collaborated closely with the devs, ideating on alternative solutions that continued to meet user needs and deliver value, all while being achievable within QuickSight's framework and our project timeline.

The unveiling of the final PoC dashboard was a momentous occasion, met with enthusiasm and accolades from DataGuardian. Their expectations were not only met but exceeded, leading to immediate discussions for further collaborations between our two companies. The success of the dashboard underscored my ability to turn complex data into an intuitive, engaging tool for decision-making.
Mastering an unfamiliar tool and navigating the new, detailed world of sales pipelines proved to be a rewarding challenge. This experience showcased my adaptability and dedication to growing my UX design skills, while also highlighting my quick ability to learn and innovate in new areas.
The success of my designs for this project sparked notable changes within our organization and beyond: